
scSidekick - Heatmaps & Dot Plots: GroupHeatmap, SplitDotPlot, FastDotPlot
05_heatmaps_dotplots.RmdOverview
Three functions for comparing gene expression across groups:
-
GroupHeatmap()- ComplexHeatmap with average expression per group, optional dot-size overlay, and gene-category annotations. -
SplitDotPlot()- dot plot organized by cell-type gene blocks; accepts amarkers_dfdata frame. -
FastDotPlot()- quick dot plot from an explicit gene list or regex pattern, nomarkers_dfrequired.
GroupHeatmap
1. Basic heatmap
GroupHeatmap(bmcite,
  group.by = "celltype.l1",
  features = bm_markers)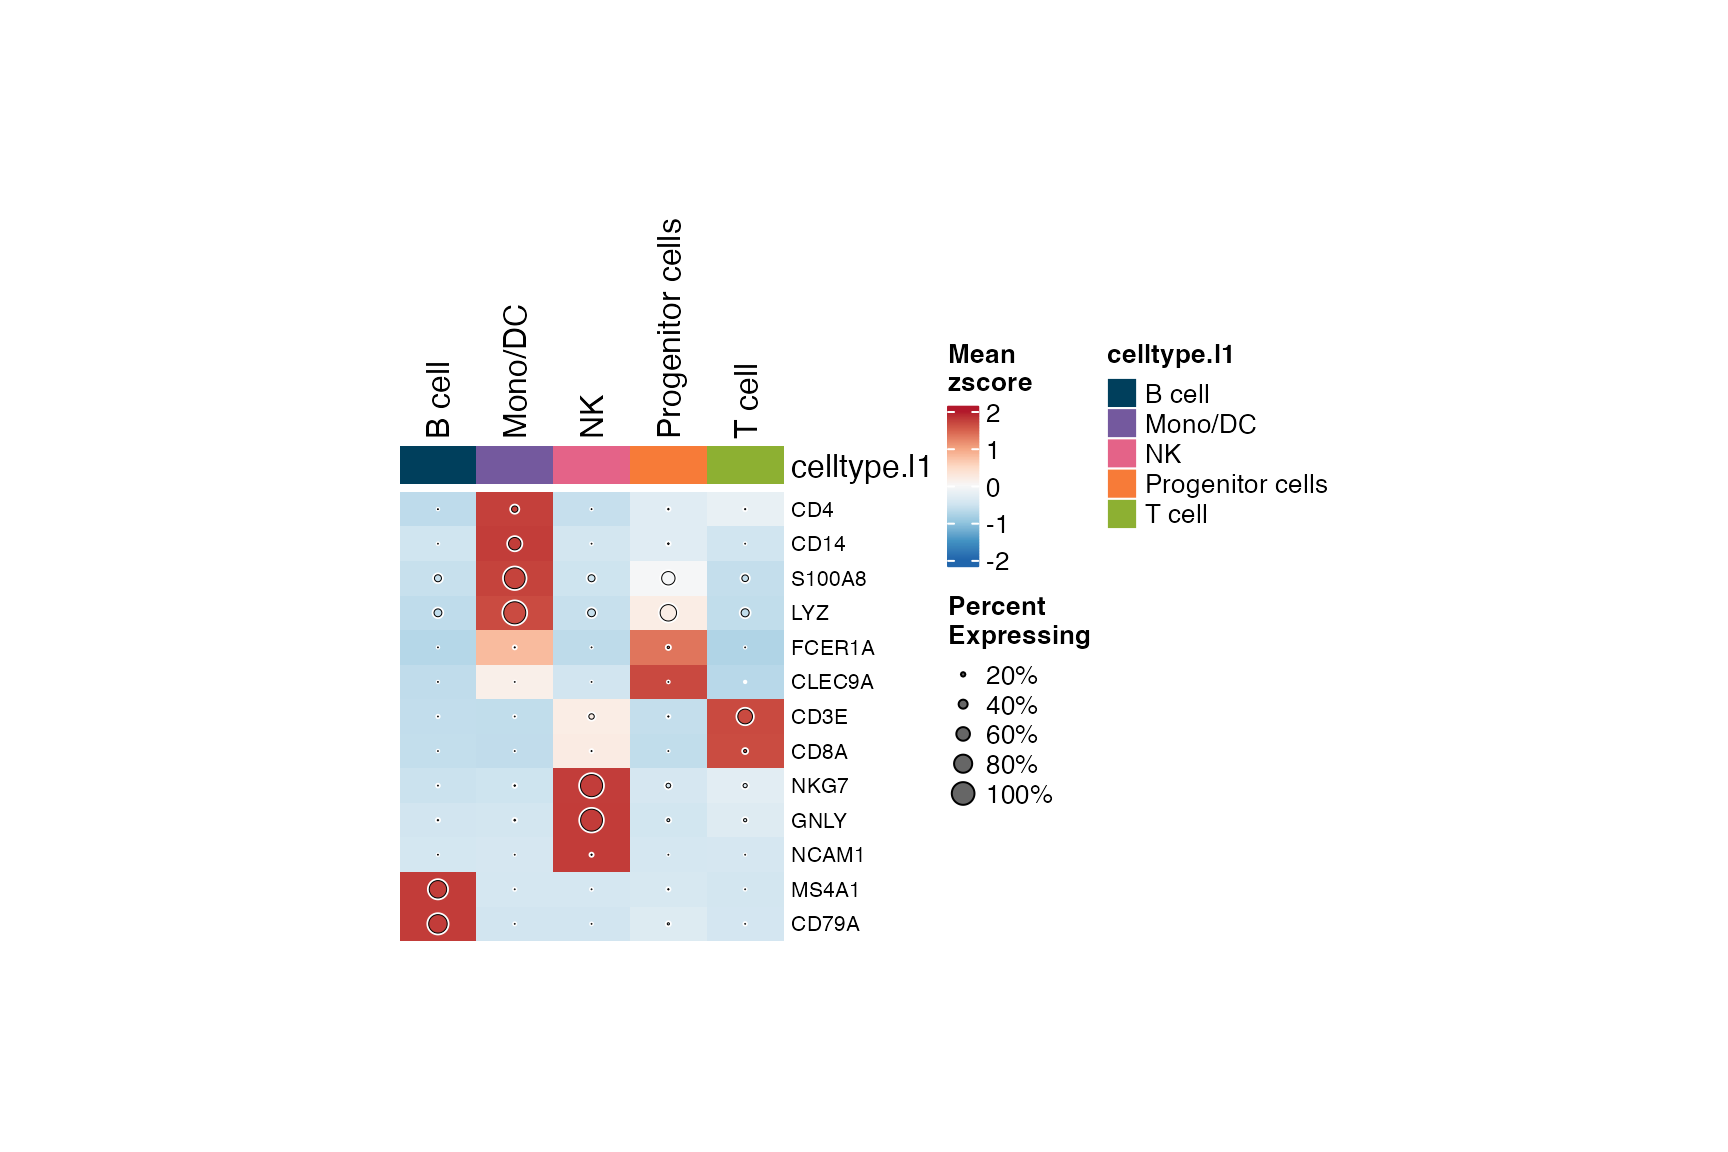
Each column is one cell type; each row is one gene. Color = scaled
mean expression (z-score across groups). Column colors at the top come
from PrepObject.
2. Gene-category row annotation with feature_split
feature_split is a named vector (names = genes, values =
category labels). Genes are grouped into labeled row blocks.
feature_split <- setNames(markers_df$CellType, markers_df$Genes)

GroupHeatmap(bmcite,
  group.by      = "celltype.l1",
  features      = names(feature_split),
  feature_split = feature_split)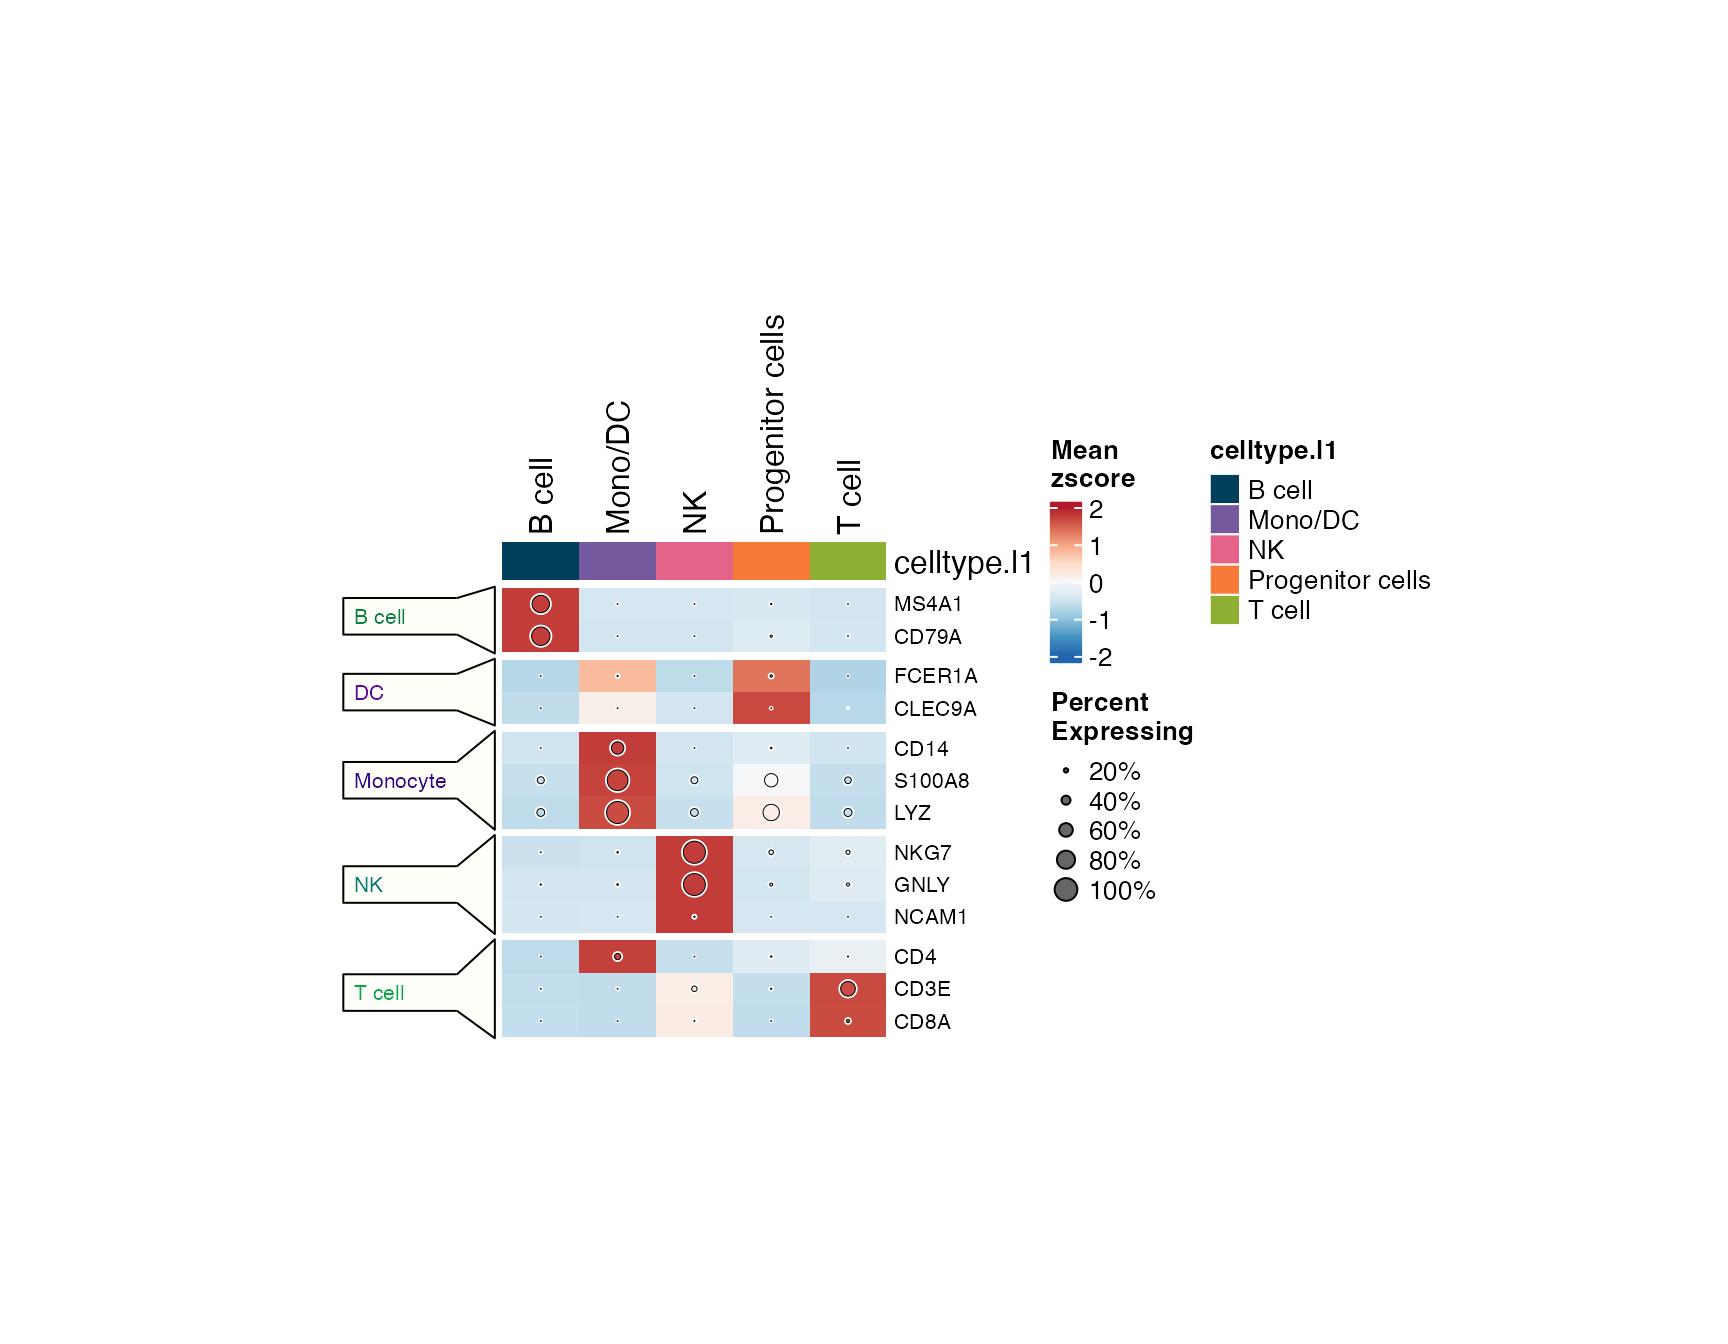
3. Dot overlay
add_dot = TRUE overlays circles sized by
percent-expressed on top of the color-encoded expression - a dot-heatmap
hybrid.
GroupHeatmap(bmcite,
  group.by = "celltype.l1",
  features = bm_markers,
  add_dot  = TRUE,
  add_bg   = TRUE)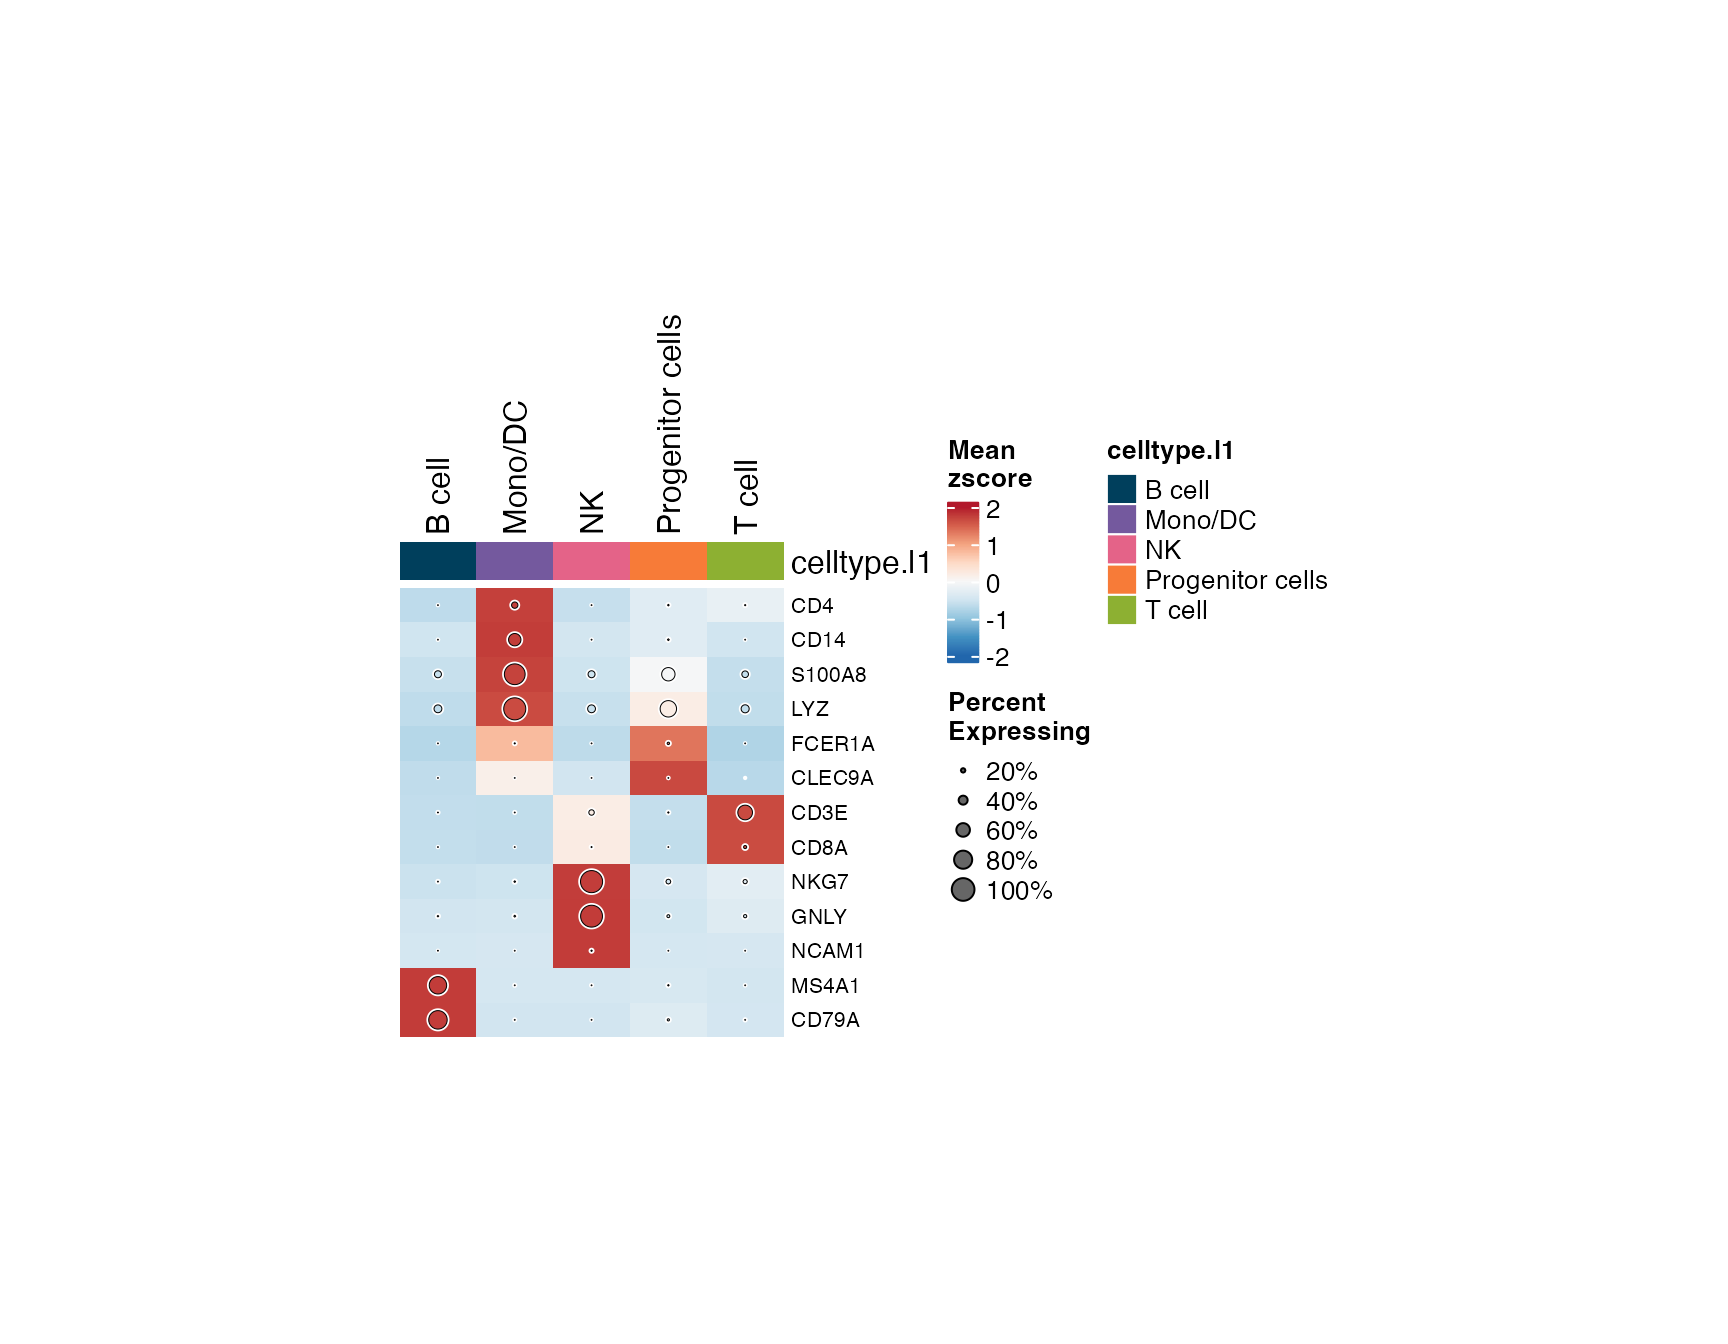
4. Multiple group.by
GroupHeatmap(bmcite,
  group.by = c("celltype.l1", "seurat_clusters"),
  features = bm_markers)
5. Saving to disk
GroupHeatmap(bmcite,
  group.by      = "celltype.l1",
  features      = names(feature_split),
  feature_split = feature_split,
  add_dot       = TRUE,
  output_dir    = "./bmcite_Figures",
  object_name   = "bmcite")
SplitDotPlot
SplitDotPlot accepts a markers_df data
frame (gene + cell-type column) and organizes genes into annotated
blocks along the x-axis.
1. Basic dot plot
SplitDotPlot(bmcite,
  markers_df = markers_df,
  group.by   = "celltype.l1")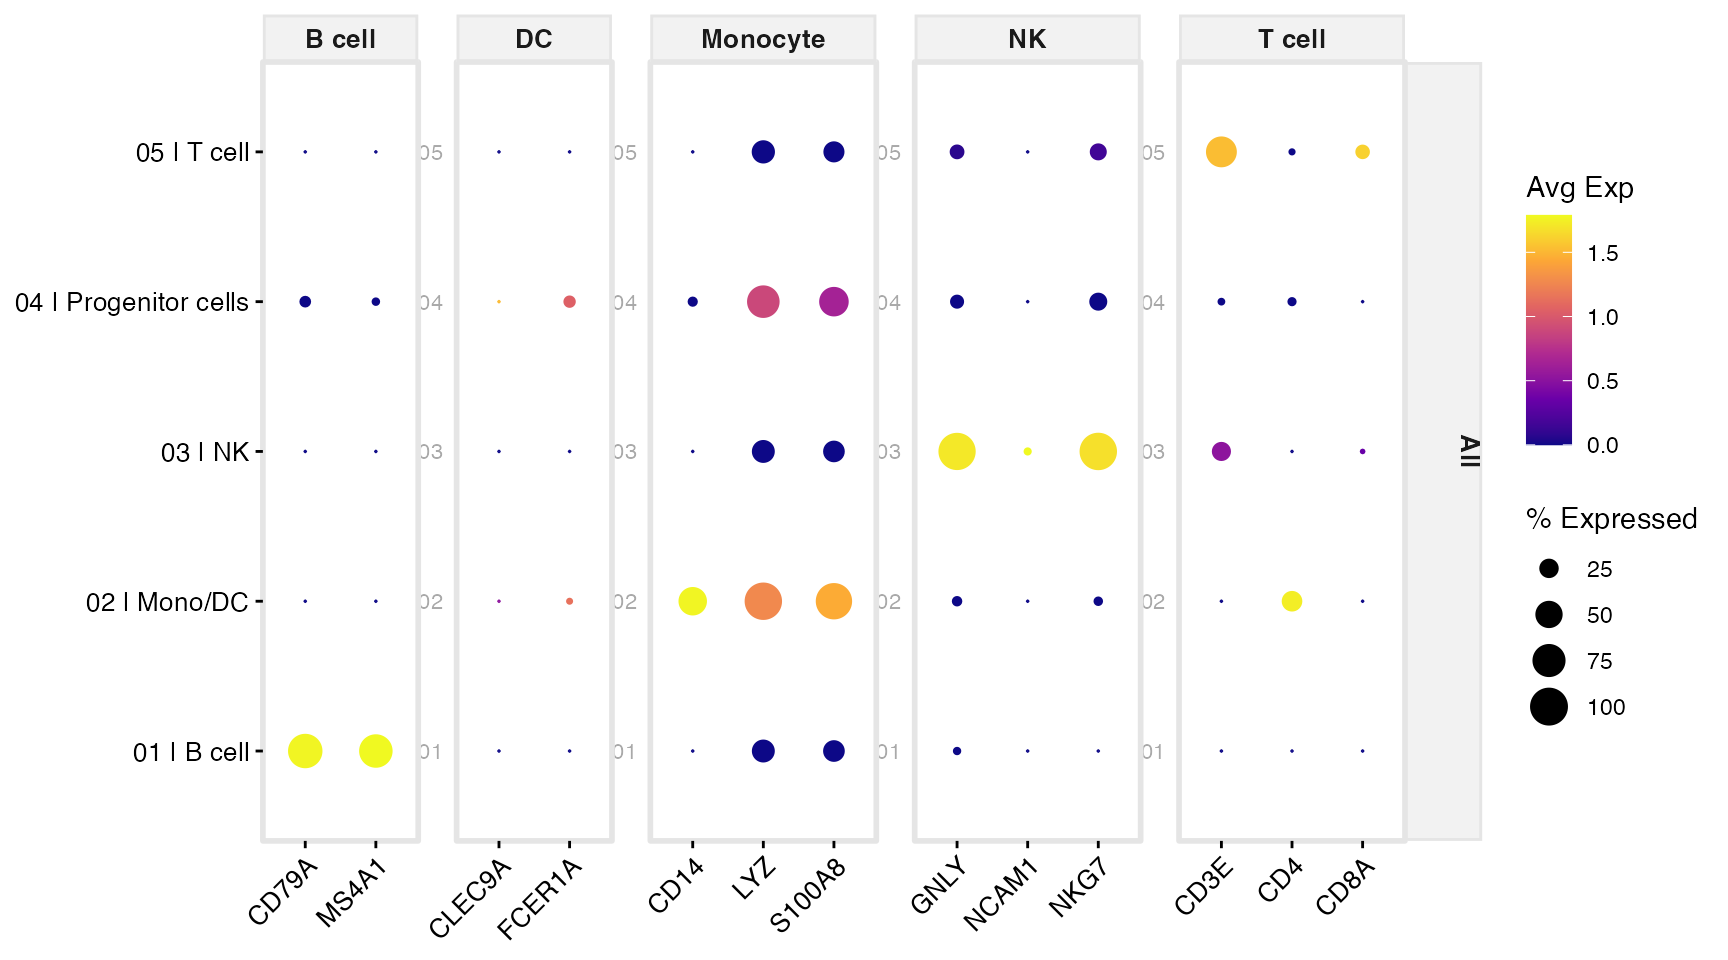
Clusters on the x-axis, grouped by their CellType block;
genes on the y-axis. Dot color = scaled mean expression; dot size =
percent-expressed.
2. With split.by
Adding split.by stacks one dot plot per level, enabling
direct expression comparison across conditions or batches.
SplitDotPlot(bmcite,
  markers_df = markers_df,
  group.by   = "celltype.l1",
  split.by   = "donor")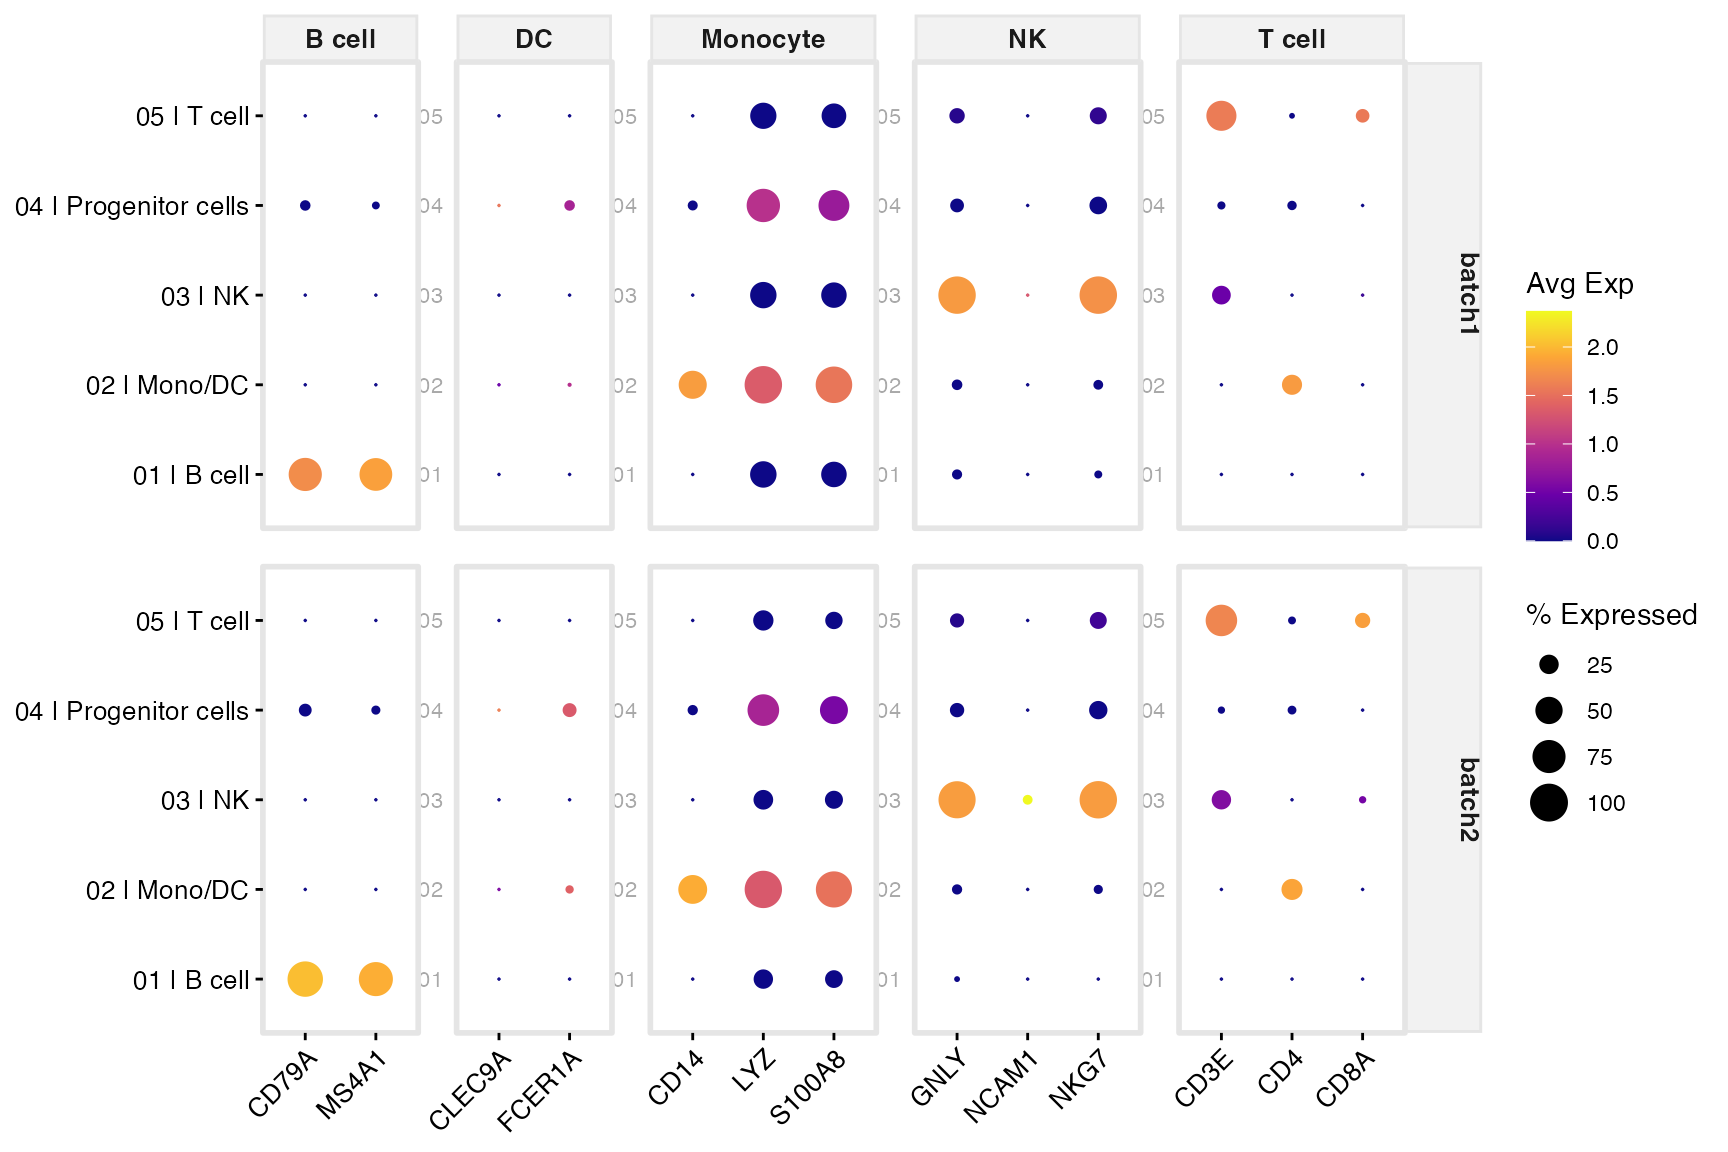
3. SplitDotPlot2 - with gene clustering
SplitDotPlot2 adds hierarchical clustering within gene
blocks.
SplitDotPlot2(bmcite,
  markers_df    = markers_df,
  group.by      = "celltype.l1",
  ClusterGenes  = TRUE,
  min.pct.exp   = 10)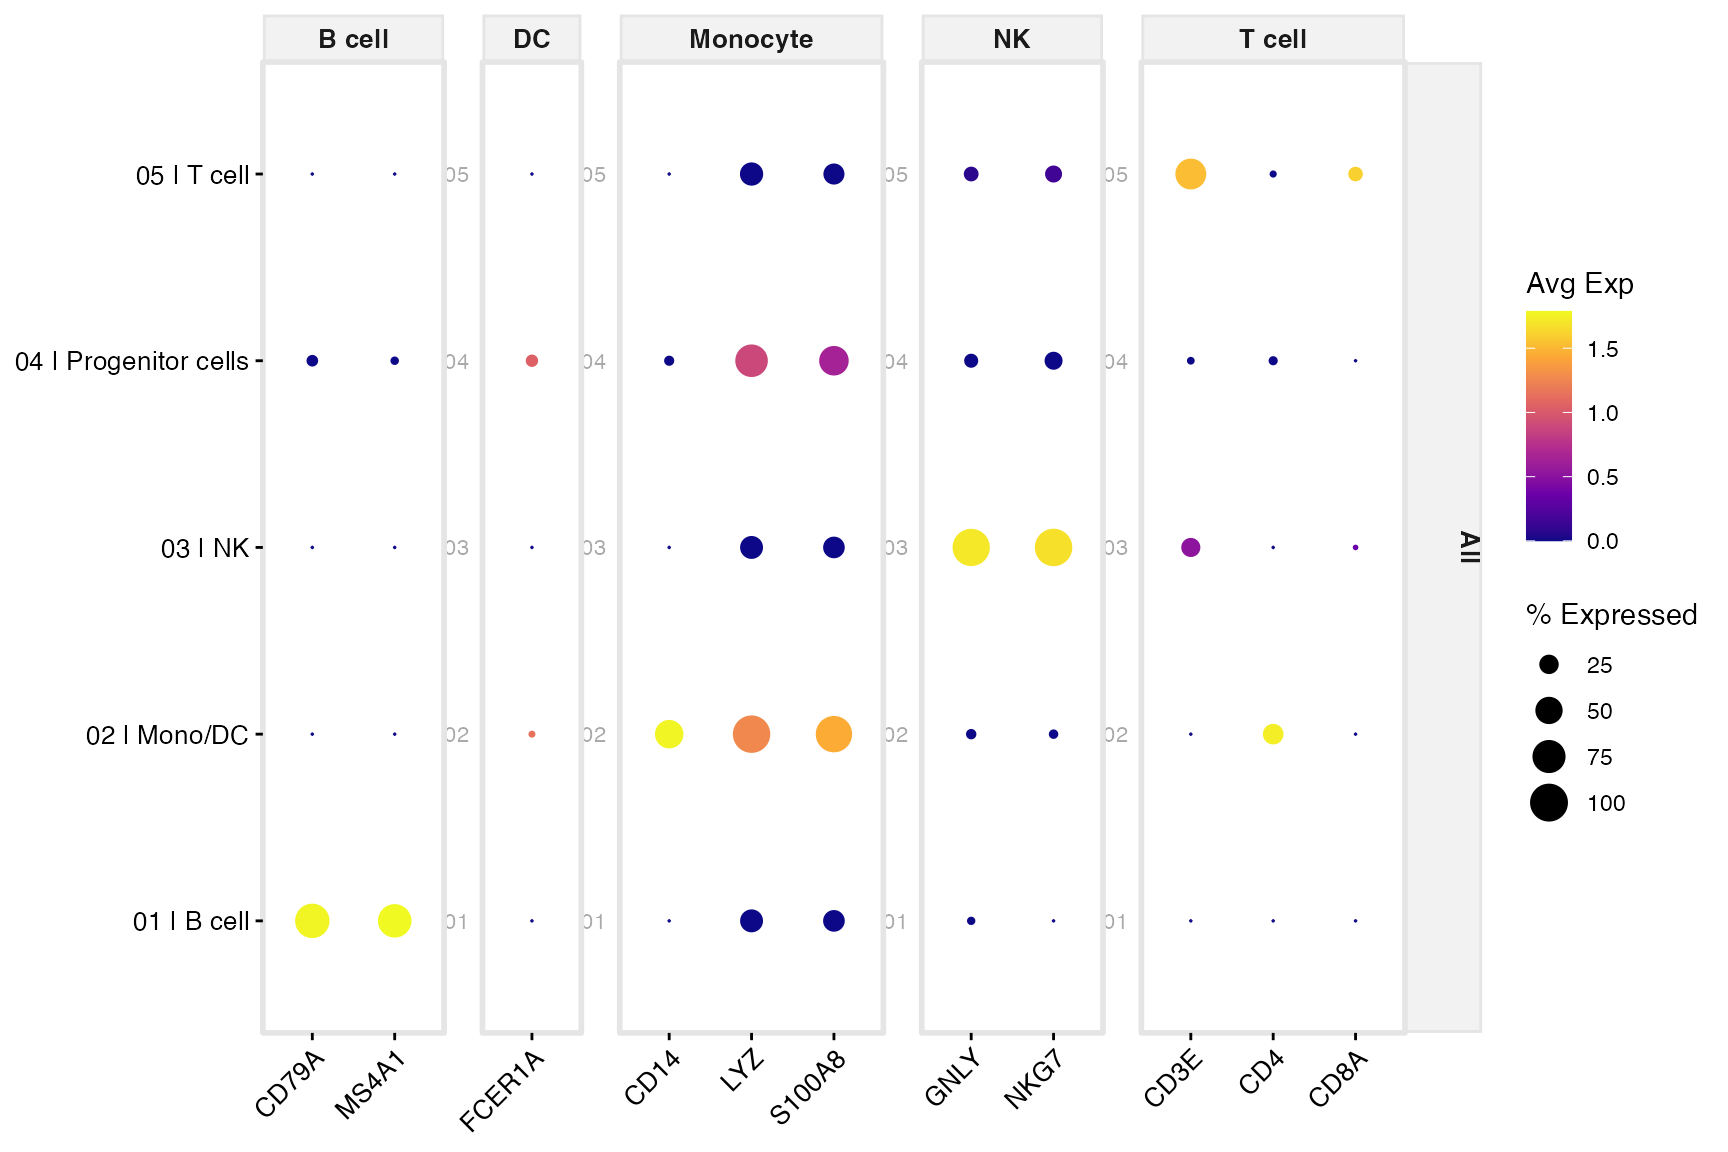
FastDotPlot
FastDotPlot is a quick path when you don’t need
cell-type block annotations.
1. Explicit gene list
FastDotPlot(bmcite,
  features = c("CD3E", "CD8A", "NKG7", "CD79A", "LYZ", "CD14"),
  group.by = "celltype.l1")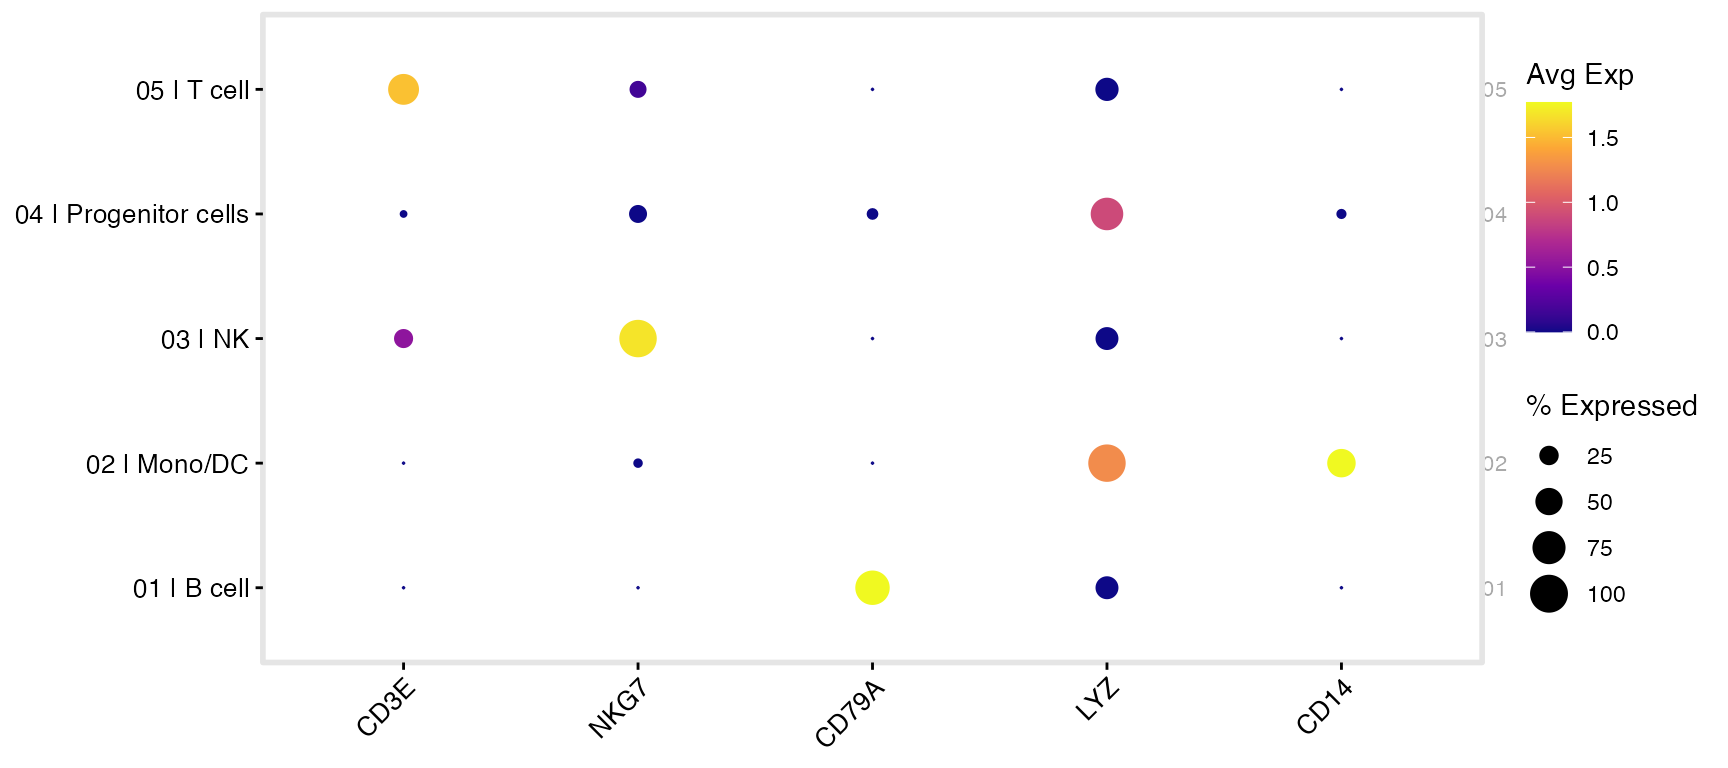
2. Regex pattern - stop looking up exact gene names
Pain point fixed. You rarely remember every gene symbol in a family. Instead of hand-typing
c("CD3D","CD3E","CD3G","CD4","CD8A", ...), giveFastDotPlot()a regexpatternand it pulls every matching gene straight fromrownames(). Same idea powers the pathway keyword search in Vignette 08 - describe what you want, not its exact name.
pattern selects all matching genes; k_genes
keeps only the top k most variable per cluster.
FastDotPlot(bmcite,
  pattern  = "^CD",          # every gene whose symbol starts with "CD"
  group.by = "celltype.l1",
  k_genes  = 3)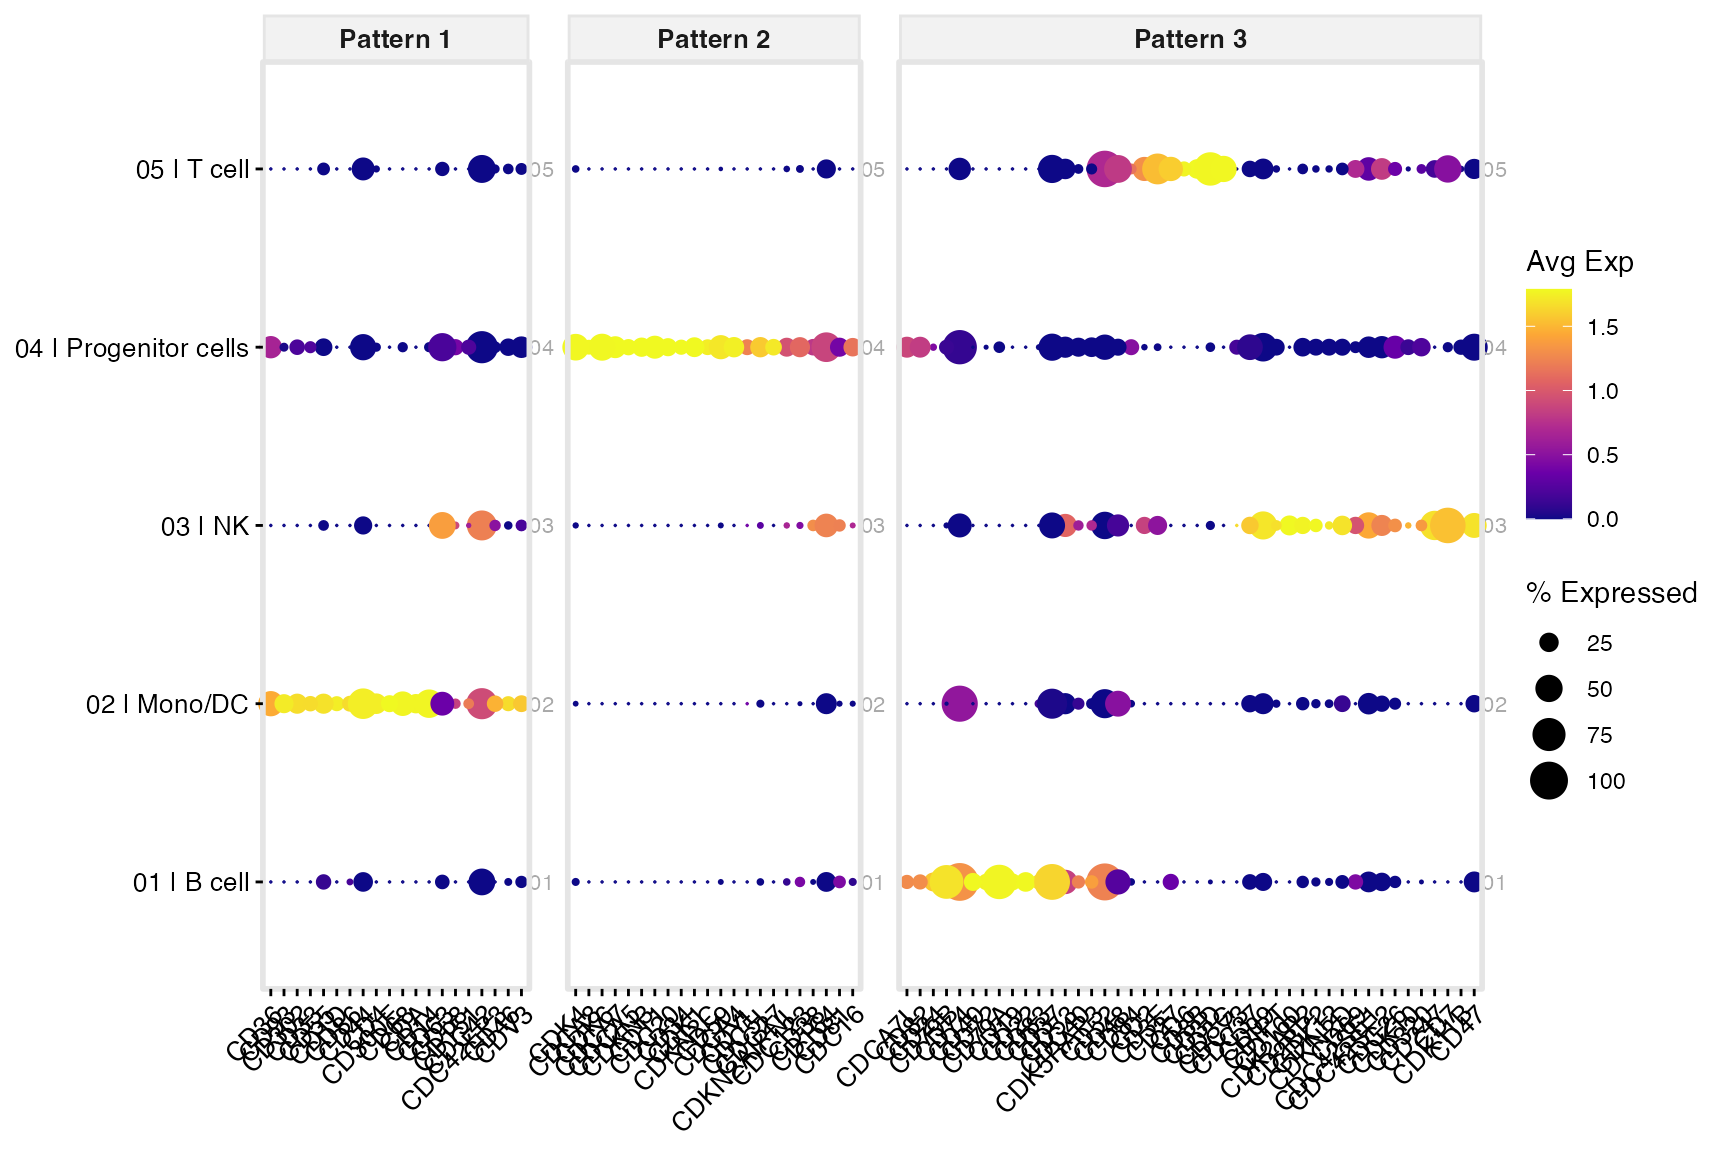
A few handy patterns: "^HLA-" (MHC genes),
"^IFI|^ISG|^OAS" (interferon response), "^MT-"
(mitochondrial). FastDotPlot2() goes further - it clusters
the matched genes into k labeled “Pattern”
groups and can run enrichR on each, so a loose regex becomes an
annotated, organized dot plot.
Parameter reference - GroupHeatmap
| Parameter | Type | Default | Description |
|---|---|---|---|
group.by |
character (vector) | required | Variable(s) defining columns |
features |
character vector | required | Genes to display |
feature_split |
named character | NULL |
Gene-to-category mapping |
column_split_by |
character | NULL |
Variable for column grouping |
add_dot |
logical | TRUE |
Overlay dots by percent-expressed |
add_bg |
logical | TRUE |
Background rectangles |
output_dir |
character | NULL |
Directory for saving |
Parameter reference - SplitDotPlot
| Parameter | Type | Default | Description |
|---|---|---|---|
markers_df |
data.frame | required | Gene-to-cell-type mapping |
gene_column |
character | "Genes" |
Column name for genes |
gene_group_column |
character | "CellType" |
Column name for group labels |
group.by |
character | "seurat_clusters" |
Metadata column for x-axis groups |
split.by |
character | NULL |
Variable for stacked panels |
Parameter reference - FastDotPlot
| Parameter | Type | Default | Description |
|---|---|---|---|
features |
character vector | NULL |
Gene list (or use pattern) |
pattern |
character | NULL |
Regex to select genes |
group.by |
character | "seurat_clusters" |
X-axis groups |
k_genes |
integer | 1 |
Top k genes per cluster (pattern mode) |
min.pct.exp |
numeric | 15 |
Min % expression filter |
See also
- Vignette 04:
PlotFeaturePlots- per-gene UMAP expression maps - Vignette 06:
CellTypeAssignmentHelper- uses markers for annotation - Vignette 08:
RunGSEA- pathway-level analysis
Session info
## R version 4.3.1 (2023-06-16)
## Platform: aarch64-apple-darwin20 (64-bit)
## Running under: macOS 15.6
##
## Matrix products: default
## BLAS:   /Library/Frameworks/R.framework/Versions/4.3-arm64/Resources/lib/libRblas.0.dylib
## LAPACK: /Library/Frameworks/R.framework/Versions/4.3-arm64/Resources/lib/libRlapack.dylib;  LAPACK version 3.11.0
##
## locale:
## [1] en_US.UTF-8/en_US.UTF-8/en_US.UTF-8/C/en_US.UTF-8/en_US.UTF-8
##
## time zone: America/Chicago
## tzcode source: internal
##
## attached base packages:
## [1] stats     graphics  grDevices utils     datasets  methods   base
##
## other attached packages:
##  [1] dplyr_1.1.4               stxBrain.SeuratData_0.1.2
##  [3] pbmc3k.SeuratData_3.1.4   panc8.SeuratData_3.0.2
##  [5] ifnb.SeuratData_3.1.0     bmcite.SeuratData_0.3.0
##  [7] SeuratData_0.2.2          Seurat_5.2.1
##  [9] SeuratObject_5.1.0        sp_2.1-3
## [11] scSidekick_1.2.0
##
## loaded via a namespace (and not attached):
##   [1] RColorBrewer_1.1-3     shape_1.4.6.1          rstudioapi_0.16.0
##   [4] jsonlite_2.0.0         magrittr_2.0.3         magick_2.8.3
##   [7] spatstat.utils_3.1-0   farver_2.1.2           rmarkdown_2.29
##  [10] GlobalOptions_0.1.2    fs_1.6.6               ragg_1.4.0
##  [13] vctrs_0.6.5            ROCR_1.0-11            Cairo_1.6-2
##  [16] spatstat.explore_3.2-7 htmltools_0.5.8.1      sass_0.4.10
##  [19] sctransform_0.4.1      parallelly_1.37.1      KernSmooth_2.23-22
##  [22] bslib_0.9.0            htmlwidgets_1.6.4      desc_1.4.3
##  [25] ica_1.0-3              plyr_1.8.9             plotly_4.10.4
##  [28] zoo_1.8-14             cachem_1.1.0           igraph_2.0.3
##  [31] iterators_1.0.14       mime_0.13              lifecycle_1.0.4
##  [34] pkgconfig_2.0.3        Matrix_1.6-5           R6_2.6.1
##  [37] fastmap_1.2.0          clue_0.3-65            fitdistrplus_1.1-11
##  [40] future_1.33.2          shiny_1.11.1           digest_0.6.37
##  [43] colorspace_2.1-1       S4Vectors_0.40.2       patchwork_1.3.1
##  [46] tensor_1.5             RSpectra_0.16-1        irlba_2.3.5.1
##  [49] textshaping_0.3.7      labeling_0.4.3         progressr_0.14.0
##  [52] spatstat.sparse_3.0-3  httr_1.4.7             polyclip_1.10-6
##  [55] abind_1.4-8            compiler_4.3.1         withr_3.0.2
##  [58] doParallel_1.0.17      S7_0.2.0               fastDummies_1.7.3
##  [61] highr_0.10             MASS_7.3-60.0.1        rappdirs_0.3.3
##  [64] rjson_0.2.21           tools_4.3.1            lmtest_0.9-40
##  [67] otel_0.2.0             httpuv_1.6.16          future.apply_1.11.2
##  [70] goftest_1.2-3          glue_1.8.0             nlme_3.1-164
##  [73] promises_1.5.0         grid_4.3.1             Rtsne_0.17
##  [76] cluster_2.1.6          reshape2_1.4.4         generics_0.1.4
##  [79] gtable_0.3.6           spatstat.data_3.0-4    tidyr_1.3.1
##  [82] data.table_1.15.4      BiocGenerics_0.48.1    spatstat.geom_3.2-9
##  [85] RcppAnnoy_0.0.22       foreach_1.5.2          ggrepel_0.9.6
##  [88] RANN_2.6.1             pillar_1.11.0          stringr_1.5.1
##  [91] spam_2.10-0            RcppHNSW_0.6.0         later_1.4.2
##  [94] circlize_0.4.16        splines_4.3.1          lattice_0.22-6
##  [97] survival_3.5-8         deldir_2.0-4           tidyselect_1.2.1
## [100] ComplexHeatmap_2.18.0  miniUI_0.1.1.1         pbapply_1.7-2
## [103] knitr_1.45             gridExtra_2.3          IRanges_2.36.0
## [106] scattermore_1.2        stats4_4.3.1           xfun_0.52
## [109] matrixStats_1.2.0      stringi_1.8.7          lazyeval_0.2.2
## [112] yaml_2.3.10            evaluate_0.23          codetools_0.2-20
## [115] tibble_3.3.0           cli_3.6.5              uwot_0.1.16
## [118] xtable_1.8-4           reticulate_1.42.0      systemfonts_1.3.2
## [121] jquerylib_0.1.4        dichromat_2.0-0.1      Rcpp_1.1.0
## [124] globals_0.16.3         spatstat.random_3.2-3  png_0.1-8
## [127] parallel_4.3.1         pkgdown_2.1.3          ggplot2_4.0.3
## [130] dotCall64_1.1-1        listenv_0.9.1          viridisLite_0.4.2
## [133] scales_1.4.0           ggridges_0.5.6         purrr_1.0.4
## [136] crayon_1.5.2           GetoptLong_1.0.5       rlang_1.1.6
## [139] cowplot_1.2.0.9000