
scSidekick - UMAP Visualization: PlotDimPlots
03_umap_visualization.RmdOverview
PlotDimPlots() generates a grid of UMAP (or any
reduction) scatter plots.
-
group.bycontrols which metadata column colors each cell -
split.bycreates one column of panels per level (one panel per donor, sample, condition, etc.) -
row.bycreates one row of panels per level - Pass a vector to
group.byand scSidekick iterates, producing one complete figure per variable
Colors come from PrepObject automatically - no need to
pass them manually.
1. Basic UMAP by cell type
PlotDimPlots(bmcite, group.by = "celltype.l1",split.by = NULL,legendnrow = 1)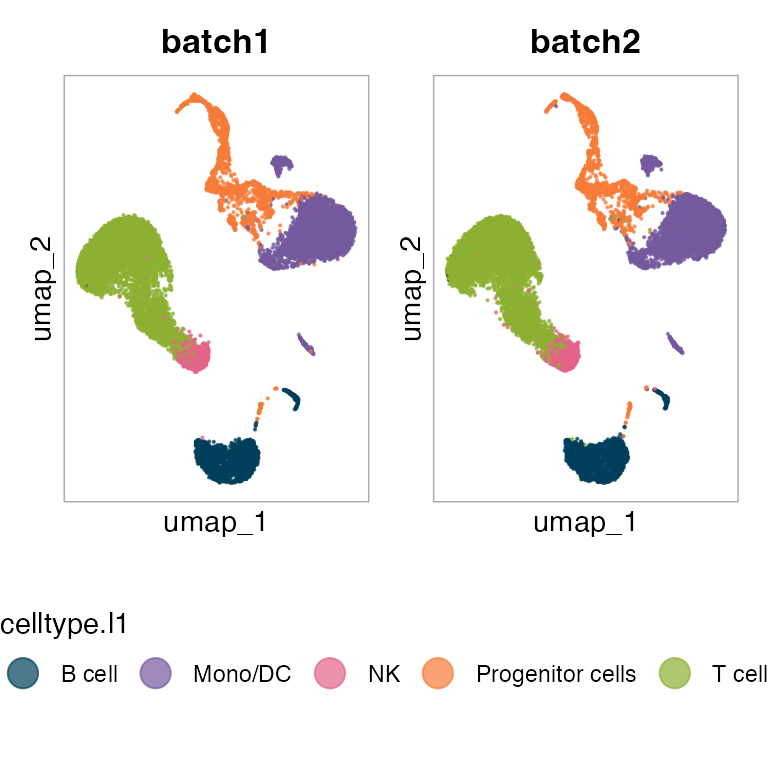
2. Split across donors
split.by = "donor" creates one panel per donor. Each
panel shows only that donor’s cells, colored by cell type. The legend is
shared.
PlotDimPlots(bmcite,
  group.by = "celltype.l1",legendnrow = 1,
  split.by = "donor")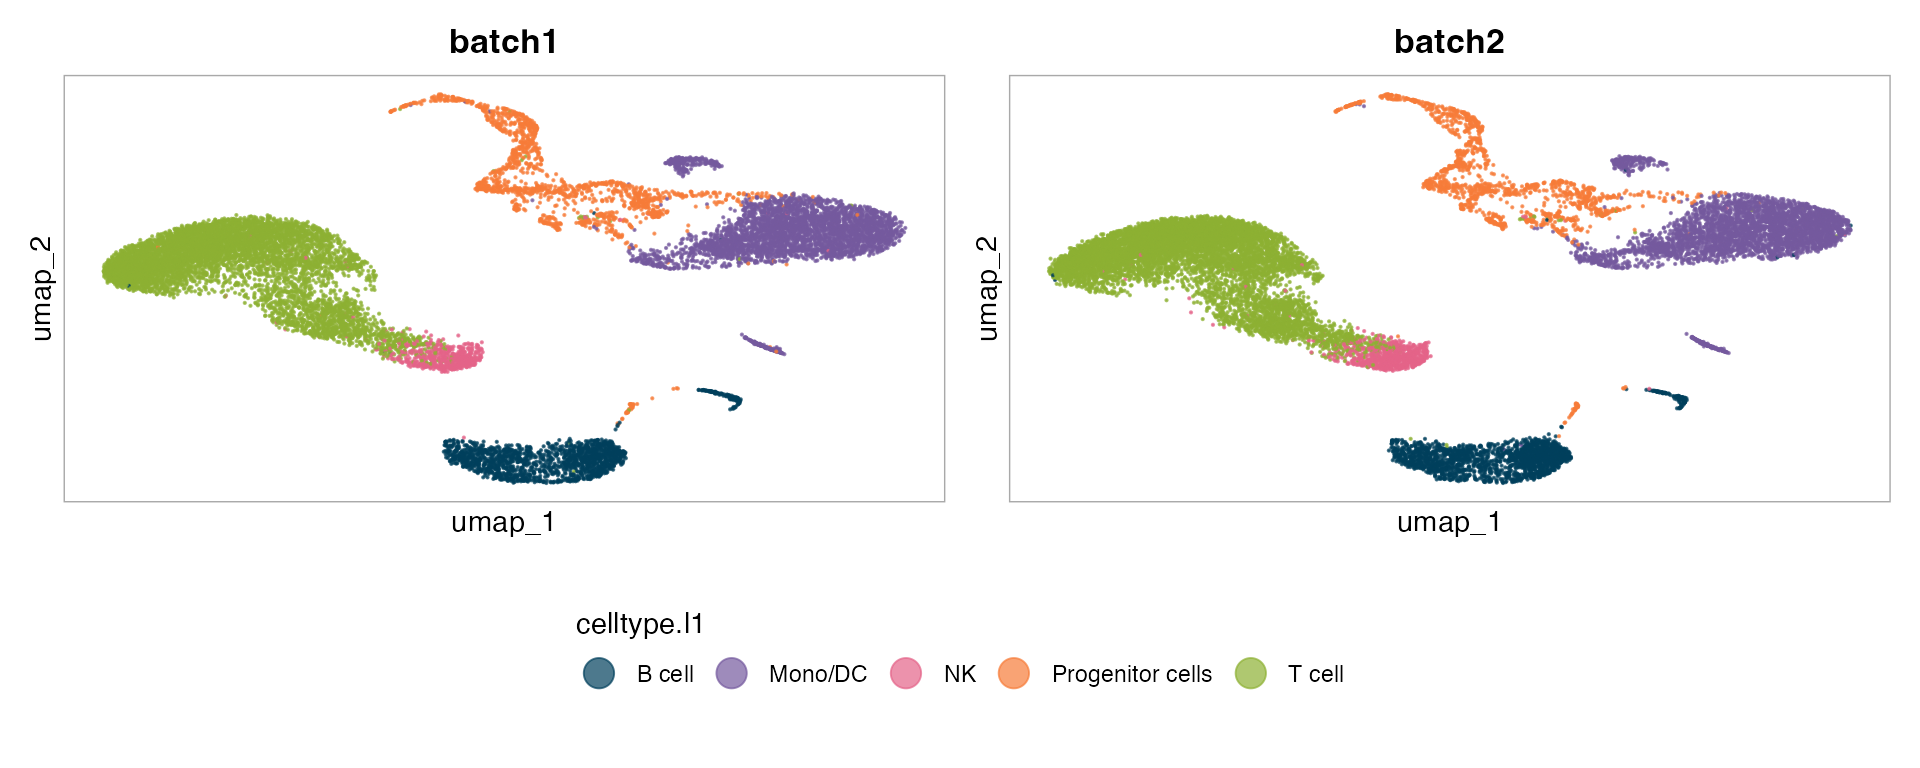
3. Adding a composition trend panel
show_trend = TRUE appends a stacked bar chart to the
left showing the proportional cell-type composition per split group.
PlotDimPlots(bmcite,
  group.by   = "celltype.l1",
  split.by   = "donor",legendnrow = 1,
  show_trend = TRUE)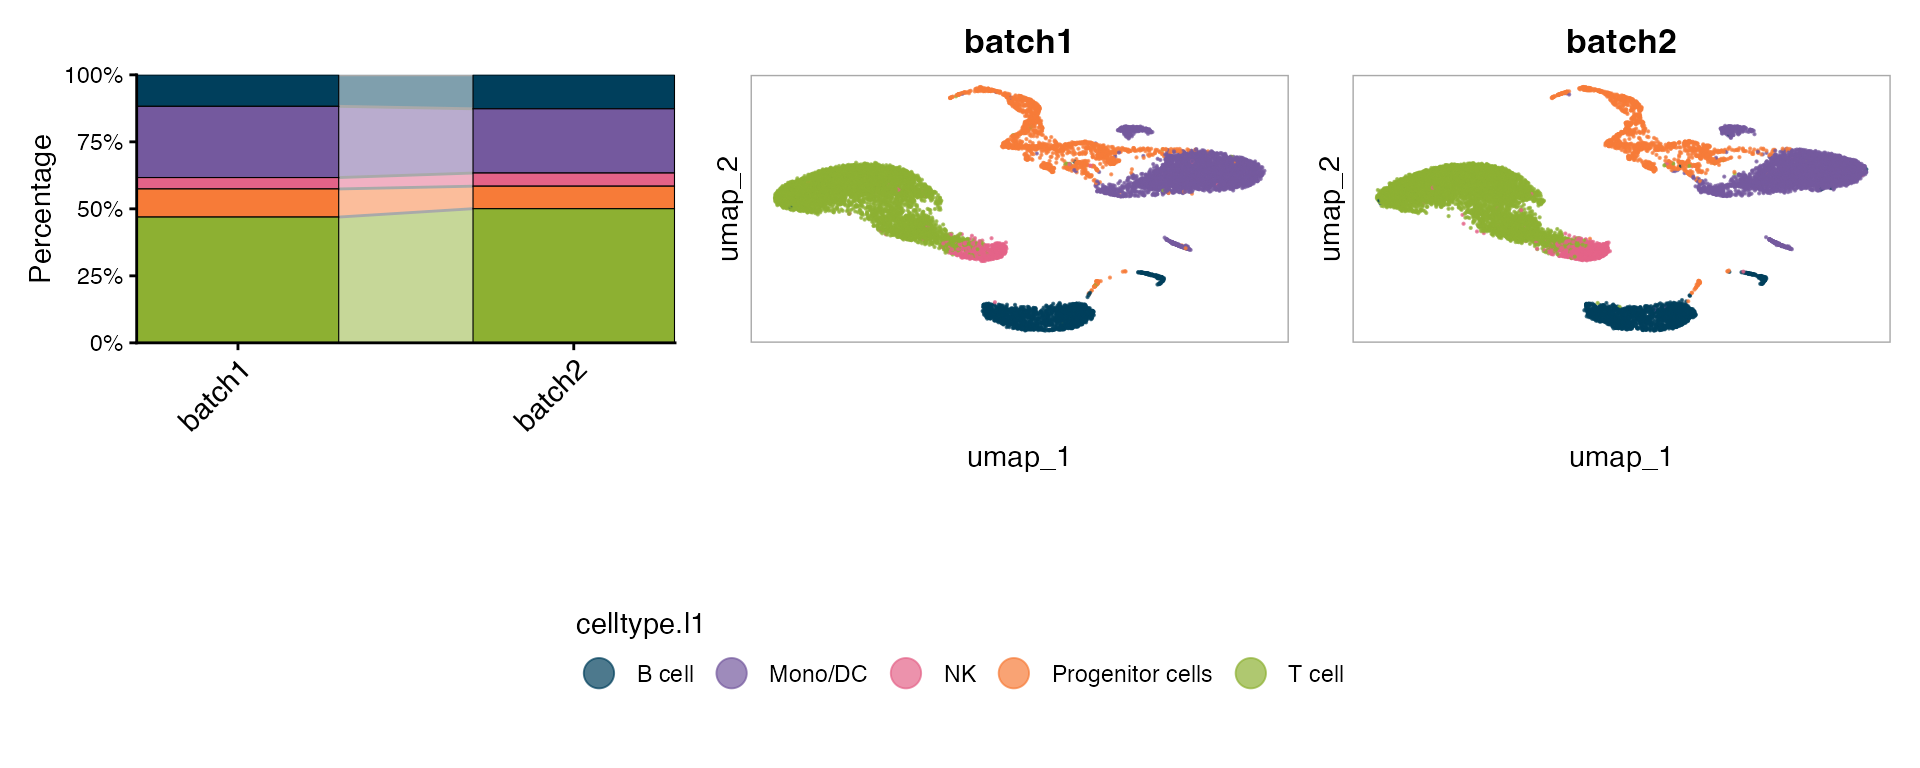
4. Cluster labels at centroids
show_labels = TRUE overlays the level name at the
centroid of each group, avoiding legend look-up.
PlotDimPlots(bmcite,
  group.by    = "celltype.l1",legendnrow = 1,
  show_labels = TRUE)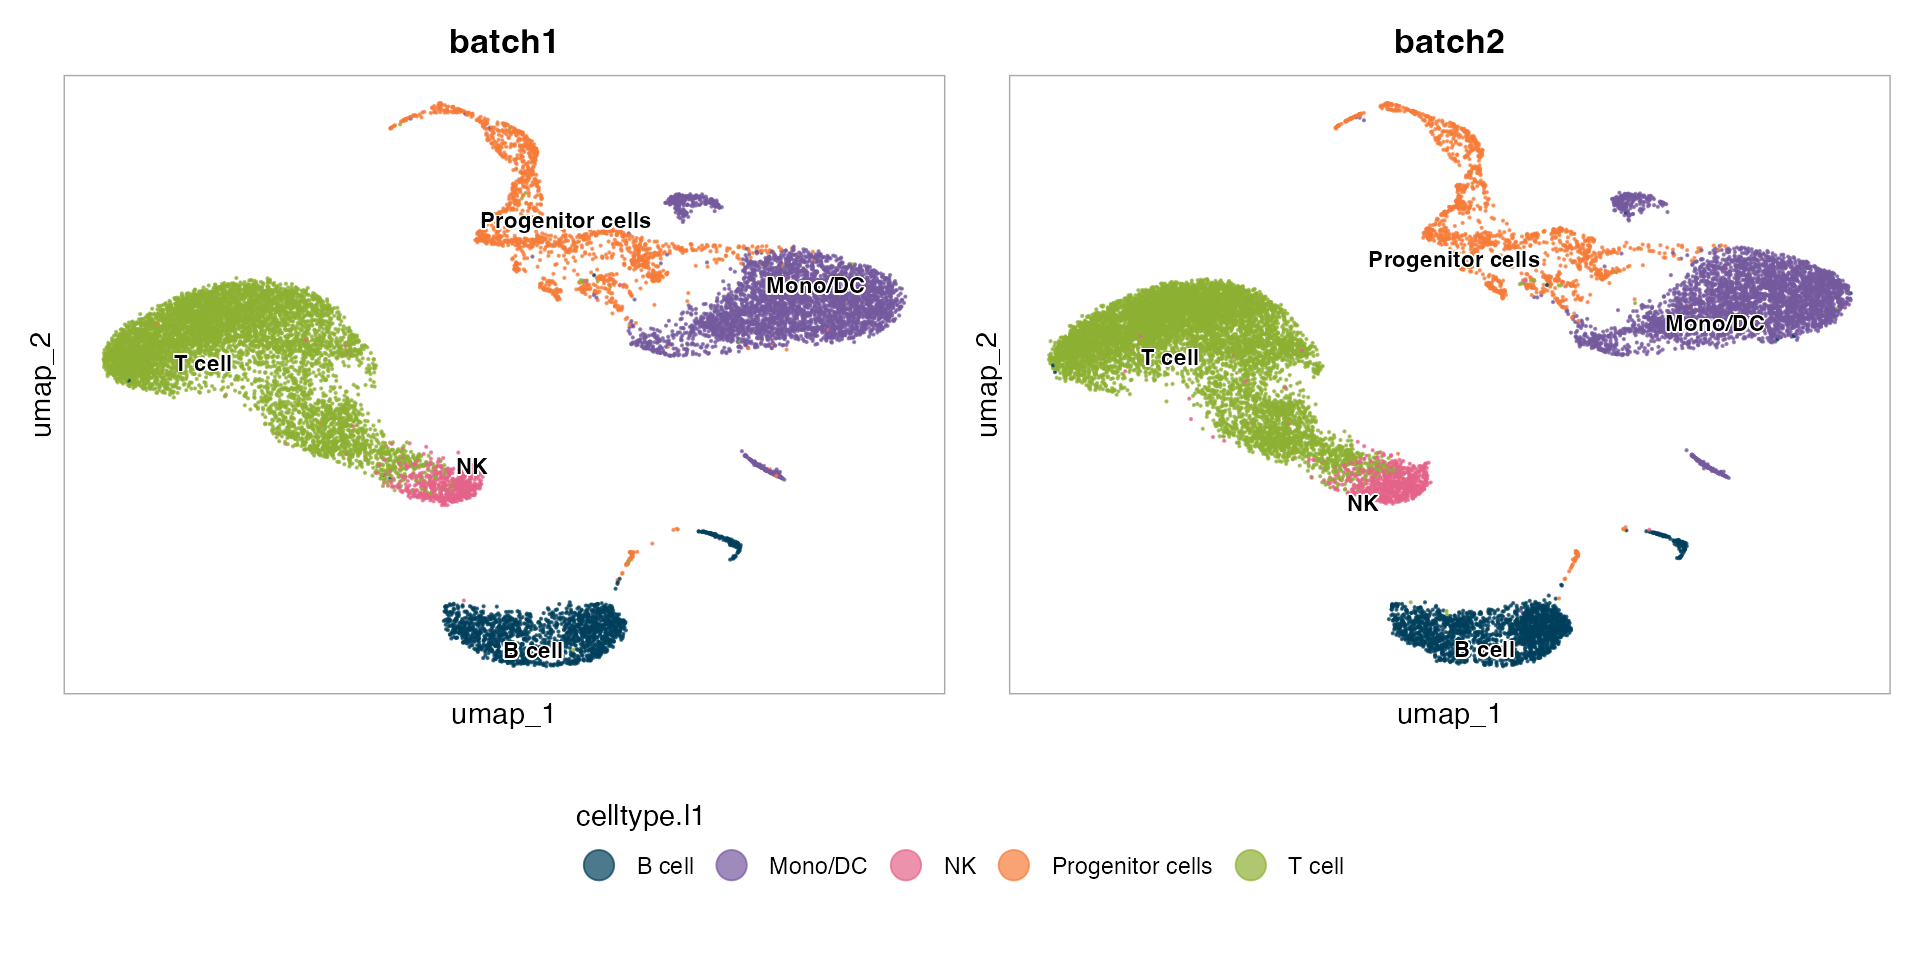
5. Multiple group.by - one figure per variable
Pass a character vector to produce one complete figure per grouping variable. This is the primary way to compare how different annotations map onto the same embedding.
p=PlotDimPlots(bmcite,
  group.by = c("celltype.l1", "celltype.l2"))
patchwork::wrap_plots(p,ncol = 1)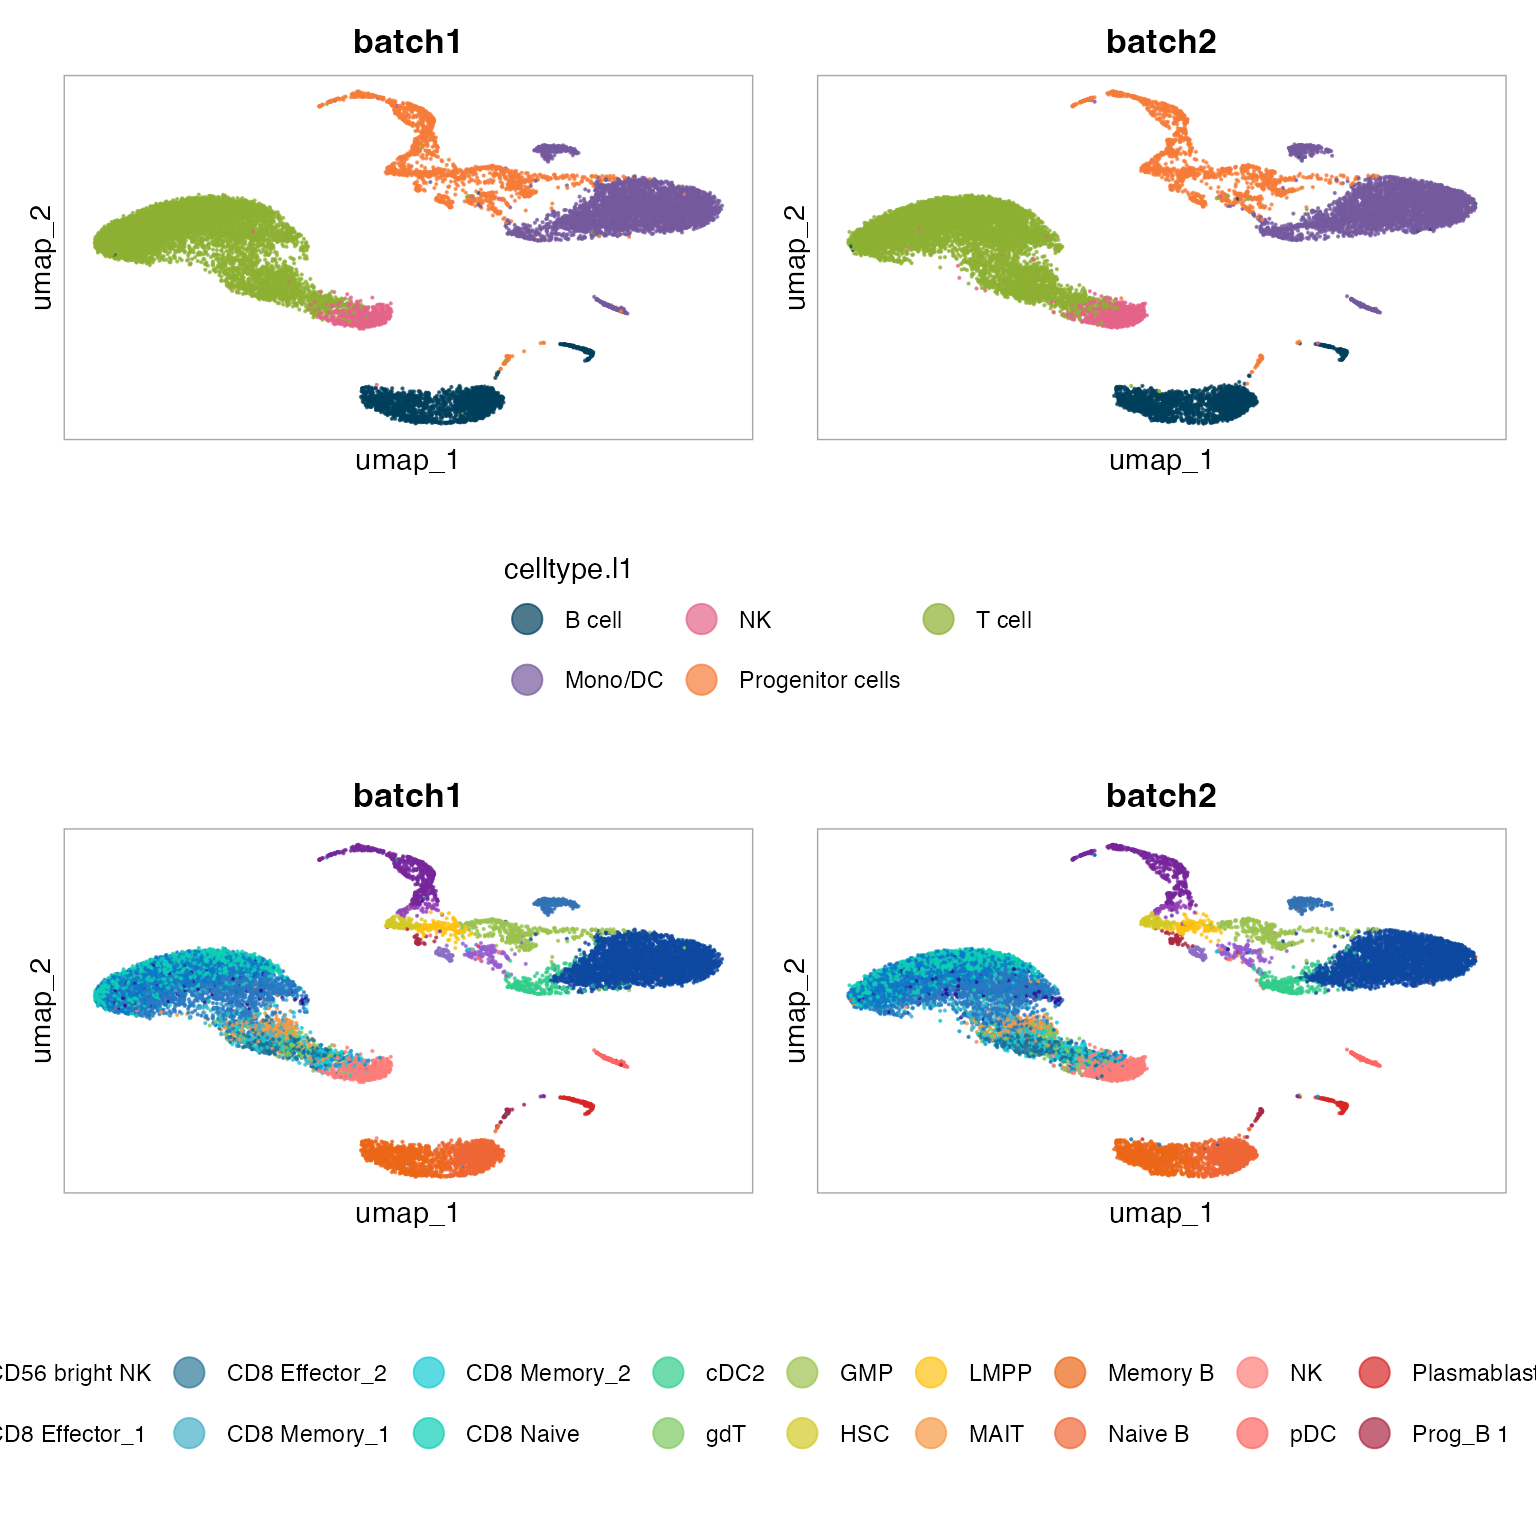
6. Row grouping with row.by
row.by creates a 2D grid: rows = levels of
row.by, columns = levels of split.by. Use this
to compare two categorical cuts simultaneously.
PlotDimPlots(bmcite,
  group.by = "celltype.l1",
  row.by = "donor",
  split.by   = "lane")
7. Custom colors
Override PrepObject defaults by passing a named vector
to colors.
my_cols <- c(
  "CD4 T"  = "#003f5c",
  "CD8 T"  = "#227ed4",
  "NK"     = "#a05195",
  "B"      = "#d45087",
  "Mono"   = "#ffa600",
  "DC"     = "#42a665"
)

PlotDimPlots(bmcite,
  group.by = "celltype.l1",
  colors   = my_cols)
8. Controlling column order
split.col.levels enforces a specific column order.
Useful when donors or samples have a meaningful biological order
(e.g. time points).
PlotDimPlots(bmcite,
  group.by         = "celltype.l1",
  split.by         = "donor",
  split.col.levels = c("batch2", "batch1"))
9. Saving to disk
Supply output_dir and object_name to
auto-save every figure as a PDF. The filename is constructed from
object_name, group.by, and
split.by.
PlotDimPlots(bmcite,
  group.by    = c("celltype.l1", "celltype.l2", "seurat_clusters"),
  split.by    = "donor",
  show_trend  = TRUE,
  output_dir  = "./bmcite_Figures",
  object_name = "bmcite",
  subset_name = "AllCells")
Parameter reference
| Parameter | Type | Default | Description |
|---|---|---|---|
group.by |
character (vector) | from PrepObject
|
Variable(s) used to color cells |
split.by |
character (vector) | from PrepObject
|
Variable(s) that create columns |
row.by |
character | NULL |
Variable that creates rows |
show_trend |
logical | FALSE |
Append stacked-bar trend panel |
show_labels |
logical | FALSE |
Overlay group labels at centroids |
number_labels |
logical | FALSE |
Use short numeric codes instead of full level names in the legend and centroid labels |
colors |
named character | NULL |
Override palette |
reduction |
character | "umap" |
Reduction to plot |
pt.size |
numeric | 0.1 |
Point size |
trend_width |
numeric | 1 |
Relative width of the trend panel |
split.col.levels |
character vector | NULL |
Explicit column ordering |
output_dir |
character | NULL |
Directory for saving figures |
file_name |
character | NULL |
Override the auto-built saved file name |
timestamp |
logical | FALSE |
Append a _YYYYMMDD-HHMMSS stamp to the saved file name
so repeated runs are versioned instead of overwritten |
object_name |
character | "" |
Label used in saved filenames |
subset_name |
character | "" |
Sub-label used in saved filenames |
See also
- Vignette 01:
PrepObject- set defaultgroup.by,split.by, and colors - Vignette 02:
Determine_nDims- choosedimsbefore runningRunUMAP() - Vignette 04:
PlotFeaturePlots- gene expression overlaid on the same layout - Vignette 10:
PlotTrendLabeled- standalone composition figure
Session info
## R version 4.3.1 (2023-06-16)
## Platform: aarch64-apple-darwin20 (64-bit)
## Running under: macOS 15.6
##
## Matrix products: default
## BLAS:   /Library/Frameworks/R.framework/Versions/4.3-arm64/Resources/lib/libRblas.0.dylib
## LAPACK: /Library/Frameworks/R.framework/Versions/4.3-arm64/Resources/lib/libRlapack.dylib;  LAPACK version 3.11.0
##
## locale:
## [1] en_US.UTF-8/en_US.UTF-8/en_US.UTF-8/C/en_US.UTF-8/en_US.UTF-8
##
## time zone: America/Chicago
## tzcode source: internal
##
## attached base packages:
## [1] stats     graphics  grDevices utils     datasets  methods   base
##
## other attached packages:
##  [1] dplyr_1.1.4               stxBrain.SeuratData_0.1.2
##  [3] pbmc3k.SeuratData_3.1.4   panc8.SeuratData_3.0.2
##  [5] ifnb.SeuratData_3.1.0     bmcite.SeuratData_0.3.0
##  [7] SeuratData_0.2.2          Seurat_5.2.1
##  [9] SeuratObject_5.1.0        sp_2.1-3
## [11] scSidekick_1.2.0
##
## loaded via a namespace (and not attached):
##   [1] RColorBrewer_1.1-3     rstudioapi_0.16.0      jsonlite_2.0.0
##   [4] magrittr_2.0.3         spatstat.utils_3.1-0   farver_2.1.2
##   [7] rmarkdown_2.29         fs_1.6.6               ragg_1.4.0
##  [10] vctrs_0.6.5            ROCR_1.0-11            spatstat.explore_3.2-7
##  [13] rstatix_0.7.2          htmltools_0.5.8.1      broom_1.0.8
##  [16] Formula_1.2-5          sass_0.4.10            sctransform_0.4.1
##  [19] parallelly_1.37.1      KernSmooth_2.23-22     bslib_0.9.0
##  [22] htmlwidgets_1.6.4      desc_1.4.3             ica_1.0-3
##  [25] plyr_1.8.9             plotly_4.10.4          zoo_1.8-14
##  [28] cachem_1.1.0           igraph_2.0.3           mime_0.13
##  [31] lifecycle_1.0.4        pkgconfig_2.0.3        Matrix_1.6-5
##  [34] R6_2.6.1               fastmap_1.2.0          fitdistrplus_1.1-11
##  [37] future_1.33.2          shiny_1.11.1           digest_0.6.37
##  [40] colorspace_2.1-1       patchwork_1.3.1        tensor_1.5
##  [43] RSpectra_0.16-1        irlba_2.3.5.1          textshaping_0.3.7
##  [46] ggpubr_0.6.1           labeling_0.4.3         progressr_0.14.0
##  [49] spatstat.sparse_3.0-3  httr_1.4.7             polyclip_1.10-6
##  [52] abind_1.4-8            compiler_4.3.1         withr_3.0.2
##  [55] backports_1.5.0        S7_0.2.0               carData_3.0-5
##  [58] fastDummies_1.7.3      highr_0.10             ggsignif_0.6.4
##  [61] MASS_7.3-60.0.1        rappdirs_0.3.3         tools_4.3.1
##  [64] lmtest_0.9-40          otel_0.2.0             httpuv_1.6.16
##  [67] future.apply_1.11.2    goftest_1.2-3          glue_1.8.0
##  [70] nlme_3.1-164           promises_1.5.0         grid_4.3.1
##  [73] Rtsne_0.17             cluster_2.1.6          reshape2_1.4.4
##  [76] generics_0.1.4         gtable_0.3.6           spatstat.data_3.0-4
##  [79] tidyr_1.3.1            data.table_1.15.4      car_3.1-3
##  [82] spatstat.geom_3.2-9    RcppAnnoy_0.0.22       ggrepel_0.9.6
##  [85] RANN_2.6.1             pillar_1.11.0          stringr_1.5.1
##  [88] spam_2.10-0            RcppHNSW_0.6.0         later_1.4.2
##  [91] splines_4.3.1          lattice_0.22-6         survival_3.5-8
##  [94] deldir_2.0-4           tidyselect_1.2.1       miniUI_0.1.1.1
##  [97] pbapply_1.7-2          knitr_1.45             gridExtra_2.3
## [100] scattermore_1.2        xfun_0.52              matrixStats_1.2.0
## [103] stringi_1.8.7          lazyeval_0.2.2         yaml_2.3.10
## [106] evaluate_0.23          codetools_0.2-20       tibble_3.3.0
## [109] cli_3.6.5              uwot_0.1.16            xtable_1.8-4
## [112] reticulate_1.42.0      systemfonts_1.3.2      jquerylib_0.1.4
## [115] dichromat_2.0-0.1      Rcpp_1.1.0             globals_0.16.3
## [118] spatstat.random_3.2-3  png_0.1-8              parallel_4.3.1
## [121] pkgdown_2.1.3          ggplot2_4.0.3          dotCall64_1.1-1
## [124] listenv_0.9.1          viridisLite_0.4.2      scales_1.4.0
## [127] ggridges_0.5.6         purrr_1.0.4            crayon_1.5.2
## [130] rlang_1.1.6            cowplot_1.2.0.9000