
scSidekick - Dimensionality Reduction: Determine_nDims
02_dim_reduction.RmdOverview
Choosing how many dimensions to retain after PCA (or LSI, ICA, etc.) is one of the most consequential decisions in a single-cell pipeline. Too few and you lose biological signal; too many and you add noise.
Determine_nDims() automates this using two complementary
heuristics and returns the more conservative (lower) of
the two - a safe default that you can override if the plot suggests
otherwise.
1. Basic call
dims <- Determine_nDims(bmcite, reduction = "pca")The console output shows both heuristics and the final selection. The plot displays every PC as a number - blue = selected, orange = discarded. Vertical lines mark the two cutoffs.
dims$plot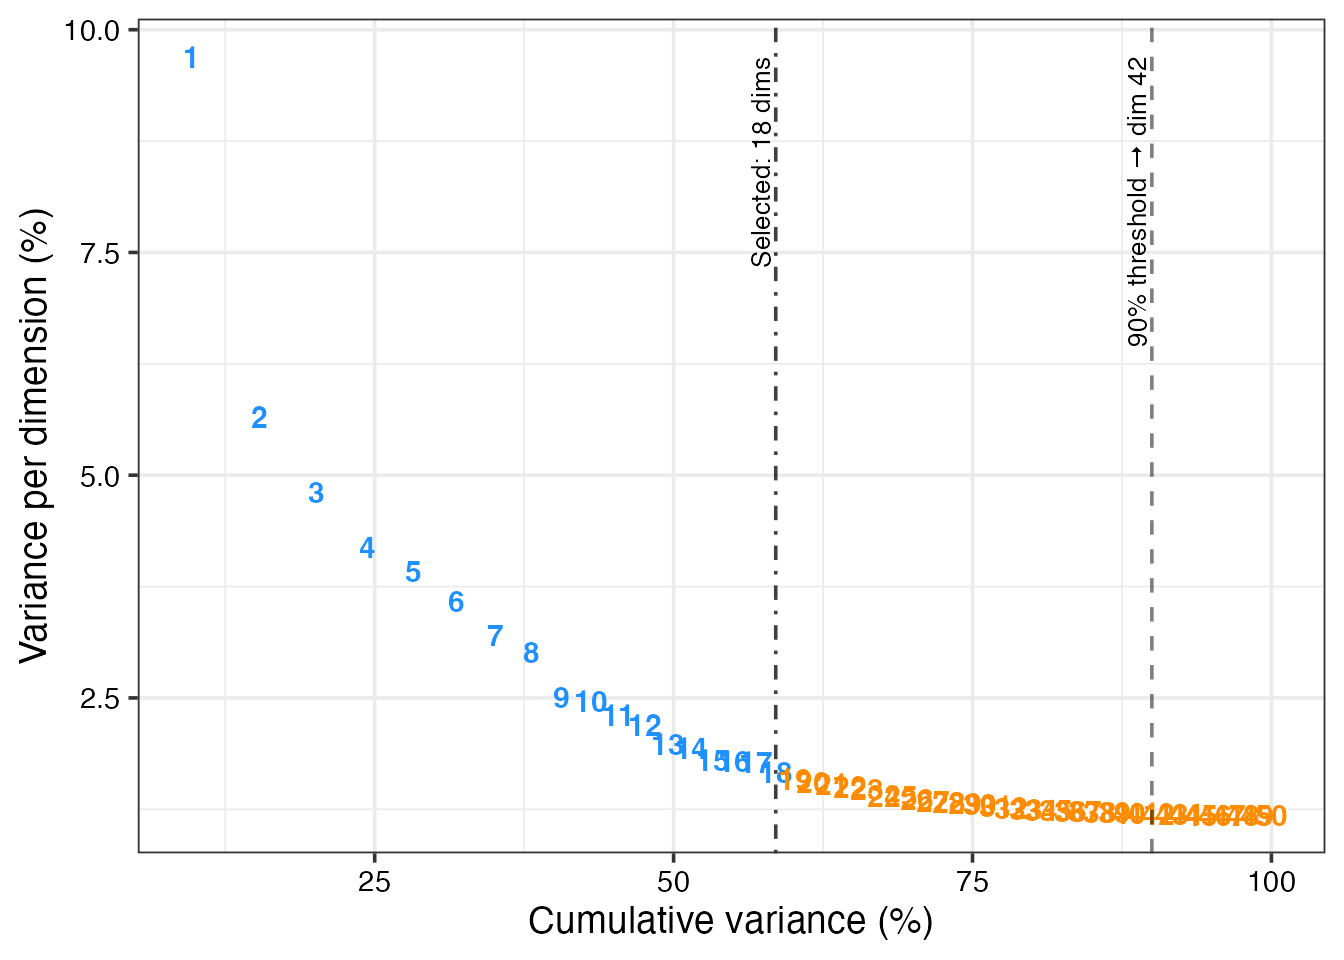
2. Accessing the result
# Recommended number of dimensions
dims$n_dims
## [1] 18
# Heuristic 1 - cumulative variance plateau
dims$cum_thresh
## [1] 42
# Heuristic 2 - elbow
dims$elbow_thresh
## [1] 18dims$n_dims is a plain integer: pass it to
dims = 1:dims$n_dims in all downstream Seurat calls to
guarantee consistency.
3. Using the result downstream
bmcite <- RunUMAP(bmcite,       dims = 1:dims$n_dims)
bmcite <- FindNeighbors(bmcite, dims = 1:dims$n_dims)
bmcite <- FindClusters(bmcite,  resolution = 0.5)
## Modularity Optimizer version 1.3.0 by Ludo Waltman and Nees Jan van Eck
##
## Number of nodes: 30672
## Number of edges: 962789
##
## Running Louvain algorithm...
## Maximum modularity in 10 random starts: 0.9093
## Number of communities: 15
## Elapsed time: 3 secondsAfter this, bmcite has a UMAP embedding and cluster
assignments ready for all visualization functions in vignettes
03-05.
4. Adjusting thresholds
The defaults (threshold_cum_pct = 90,
threshold_pct = 5) work well for most datasets. Adjust them
if the elbow plot looks unusual.
# Stricter: require 85 % cumulative variance, per-dim contribution < 3 %
dims_strict <- Determine_nDims(bmcite,
  threshold_cum_pct = 85,
  threshold_pct     = 3)
dims_strict$n_dims

# More permissive: 95 % cumulative, 1 % marginal drop
dims_loose <- Determine_nDims(bmcite,
  threshold_cum_pct = 95,
  threshold_pct     = 1)
dims_loose$n_dims
5. Using with any linear reduction
The function works with any named reduction slot - PCA, LSI (ATAC), ICA, or Harmony.
# After RunHarmony():
library(harmony)
bmcite <- RunHarmony(bmcite, group.by.vars = "donor")
dims_h <- Determine_nDims(bmcite, reduction = "harmony")
6. Saving the elbow plot
dims$plot is a standard ggplot2 object.
ggplot2::ggsave(
  filename = "bmcite_elbow.pdf",
  plot     = dims$plot,
  width    = 6, height = 4)
Parameter reference
| Parameter | Type | Default | Description |
|---|---|---|---|
seurat_object |
Seurat | required | Object with a linear reduction computed |
reduction |
character | "pca" |
Name of the reduction slot |
threshold_pct |
numeric | 5 |
Max per-dim variance (%) for a selected dimension |
threshold_cum_pct |
numeric | 90 |
Target cumulative variance (%) |
threshold_diff_pct |
numeric | 0.1 |
Min consecutive drop to count as elbow |
elbow_plot |
logical | TRUE |
Return annotated elbow plot |
Return value
| Element | Type | Description |
|---|---|---|
$n_dims |
integer | Recommended number of dimensions |
$cum_thresh |
integer | Dimension from heuristic 1 (cumulative plateau) |
$elbow_thresh |
integer | Dimension from heuristic 2 (elbow) |
$plot |
ggplot | Annotated elbow plot |
See also
- Vignette 01:
PrepObject- run after clustering to register colors - Vignette 03:
PlotDimPlots- UMAP visualization afterRunUMAP(dims = 1:dims$n_dims)
Session info
## R version 4.3.1 (2023-06-16)
## Platform: aarch64-apple-darwin20 (64-bit)
## Running under: macOS 15.6
##
## Matrix products: default
## BLAS:   /Library/Frameworks/R.framework/Versions/4.3-arm64/Resources/lib/libRblas.0.dylib
## LAPACK: /Library/Frameworks/R.framework/Versions/4.3-arm64/Resources/lib/libRlapack.dylib;  LAPACK version 3.11.0
##
## locale:
## [1] en_US.UTF-8/en_US.UTF-8/en_US.UTF-8/C/en_US.UTF-8/en_US.UTF-8
##
## time zone: America/Chicago
## tzcode source: internal
##
## attached base packages:
## [1] stats     graphics  grDevices utils     datasets  methods   base
##
## other attached packages:
##  [1] dplyr_1.1.4               stxBrain.SeuratData_0.1.2
##  [3] pbmc3k.SeuratData_3.1.4   panc8.SeuratData_3.0.2
##  [5] ifnb.SeuratData_3.1.0     bmcite.SeuratData_0.3.0
##  [7] SeuratData_0.2.2          Seurat_5.2.1
##  [9] SeuratObject_5.1.0        sp_2.1-3
## [11] scSidekick_1.2.0
##
## loaded via a namespace (and not attached):
##   [1] RColorBrewer_1.1-3     rstudioapi_0.16.0      jsonlite_2.0.0
##   [4] magrittr_2.0.3         spatstat.utils_3.1-0   farver_2.1.2
##   [7] rmarkdown_2.29         fs_1.6.6               ragg_1.4.0
##  [10] vctrs_0.6.5            ROCR_1.0-11            spatstat.explore_3.2-7
##  [13] htmltools_0.5.8.1      sass_0.4.10            sctransform_0.4.1
##  [16] parallelly_1.37.1      KernSmooth_2.23-22     bslib_0.9.0
##  [19] htmlwidgets_1.6.4      desc_1.4.3             ica_1.0-3
##  [22] plyr_1.8.9             plotly_4.10.4          zoo_1.8-14
##  [25] cachem_1.1.0           igraph_2.0.3           mime_0.13
##  [28] lifecycle_1.0.4        pkgconfig_2.0.3        Matrix_1.6-5
##  [31] R6_2.6.1               fastmap_1.2.0          fitdistrplus_1.1-11
##  [34] future_1.33.2          shiny_1.11.1           digest_0.6.37
##  [37] colorspace_2.1-1       patchwork_1.3.1        tensor_1.5
##  [40] RSpectra_0.16-1        irlba_2.3.5.1          textshaping_0.3.7
##  [43] labeling_0.4.3         progressr_0.14.0       spatstat.sparse_3.0-3
##  [46] httr_1.4.7             polyclip_1.10-6        abind_1.4-8
##  [49] compiler_4.3.1         withr_3.0.2            S7_0.2.0
##  [52] fastDummies_1.7.3      highr_0.10             MASS_7.3-60.0.1
##  [55] rappdirs_0.3.3         tools_4.3.1            lmtest_0.9-40
##  [58] otel_0.2.0             httpuv_1.6.16          future.apply_1.11.2
##  [61] goftest_1.2-3          glue_1.8.0             nlme_3.1-164
##  [64] promises_1.5.0         grid_4.3.1             Rtsne_0.17
##  [67] cluster_2.1.6          reshape2_1.4.4         generics_0.1.4
##  [70] gtable_0.3.6           spatstat.data_3.0-4    tidyr_1.3.1
##  [73] data.table_1.15.4      spatstat.geom_3.2-9    RcppAnnoy_0.0.22
##  [76] ggrepel_0.9.6          RANN_2.6.1             pillar_1.11.0
##  [79] stringr_1.5.1          spam_2.10-0            RcppHNSW_0.6.0
##  [82] later_1.4.2            splines_4.3.1          lattice_0.22-6
##  [85] survival_3.5-8         deldir_2.0-4           tidyselect_1.2.1
##  [88] miniUI_0.1.1.1         pbapply_1.7-2          knitr_1.45
##  [91] gridExtra_2.3          scattermore_1.2        xfun_0.52
##  [94] matrixStats_1.2.0      stringi_1.8.7          lazyeval_0.2.2
##  [97] yaml_2.3.10            evaluate_0.23          codetools_0.2-20
## [100] tibble_3.3.0           cli_3.6.5              uwot_0.1.16
## [103] xtable_1.8-4           reticulate_1.42.0      systemfonts_1.3.2
## [106] jquerylib_0.1.4        dichromat_2.0-0.1      Rcpp_1.1.0
## [109] globals_0.16.3         spatstat.random_3.2-3  png_0.1-8
## [112] parallel_4.3.1         pkgdown_2.1.3          ggplot2_4.0.3
## [115] dotCall64_1.1-1        listenv_0.9.1          viridisLite_0.4.2
## [118] scales_1.4.0           ggridges_0.5.6         purrr_1.0.4
## [121] crayon_1.5.2           rlang_1.1.6            cowplot_1.2.0.9000